
 Exercises Enhance Data-Driven Decision Making?")
Business Intelligence (BI) is a crucial component in modern business practices, offering tools and methodologies that help companies make data-driven decisions. It encompasses technologies, strategies, and tools that gather, analyze, and present data to assist in decision-making. With the vast amounts of data being generated today, businesses can leverage this information to improve operational efficiency, enhance customer satisfaction, and boost profitability.
The role of Business Intelligence in data-driven decision-making is undeniable. It enables businesses to convert raw data into actionable insights. Through BI exercises, companies can align their strategies with data-backed insights, improving outcomes and ensuring a competitive edge. This is where business intelligence exercises come in. They are designed to help individuals and organizations develop the essential skills needed to analyze data, build dashboards, and derive actionable insights. As organizations become more data-driven, the need for these skills continues to rise.
In this article, we will explore how business intelligence exercises can significantly contribute to developing real-world BI skills, enhancing personal brands, and ultimately fostering a deeper understanding of data-driven decision-making in business contexts.
What Are Business Intelligence Exercises?
Business Intelligence Exercises are hands-on tasks that simulate real-world business scenarios. These exercises are aimed at helping individuals develop BI skills that are directly applicable to professional environments. By performing these tasks, participants learn how to analyze data, identify trends, create visualizations, and ultimately make informed decisions based on their findings. The exercises vary in complexity, ranging from basic data analysis to advanced predictive modeling and scenario planning.
These exercises simulate key tasks such as building interactive dashboards, segmenting customers, and creating forecasts. They are structured to help participants grasp complex BI concepts in a practical, engaging way, which is crucial for mastering BI tools and techniques. Whether you’re a beginner or an experienced professional, engaging in business intelligence exercises will help enhance your proficiency with BI tools like Power BI, Tableau, and SQL.
Benefits of BI Exercises
- Proficiency with BI Tools: By practicing with real datasets, you improve your familiarity with tools like Excel, Power BI, and SQL, which are widely used in the industry.
- Critical Thinking and Data Analysis: These exercises encourage you to think critically about data and make sense of complex patterns and trends.
- Communication and Visualization Skills: BI exercises also focus on effectively presenting your findings through visualization techniques, which is essential for conveying insights to decision-makers.
Key Business Intelligence Tools and Skills
Business Intelligence tools are software platforms and applications used to gather, analyze, and present business data. These tools help users turn raw data into actionable insights that support decision-making. BI tools can vary in functionality but generally offer data collection, reporting, visualization, and predictive capabilities.
BI Tools for Data Analysis
BI tools are an essential part of any business intelligence exercise. These tools assist in analyzing data from various sources, identifying trends, and presenting insights in a digestible format. Some of the most popular tools include:
- Excel: Despite its simplicity, Excel is a powerful tool for data analysis, offering features like pivot tables, formulas, and data visualization options.
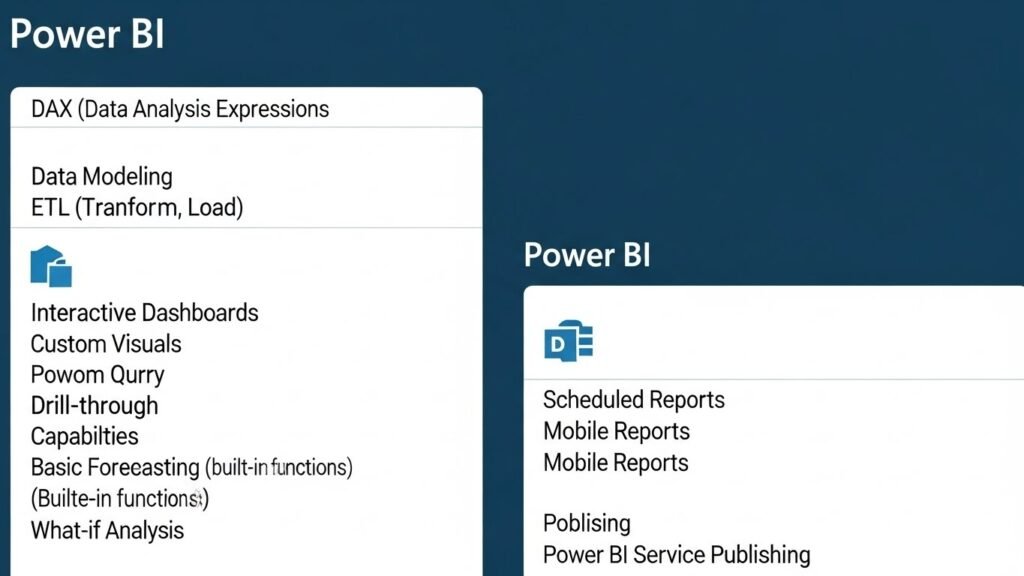
- Power BI: A robust tool from Microsoft, Power BI allows users to connect to multiple data sources, analyze them, and create dynamic dashboards.
- Tableau: Known for its user-friendly interface, Tableau excels in creating interactive visualizations and dashboards.
- SQL: SQL (Structured Query Language) is a foundational skill for accessing and analyzing data stored in relational databases. It is often used in conjunction with other BI tools.
- Python: Python is an open-source programming language that is widely used for data manipulation, statistical modeling, and machine learning.
Essential BI Skills
To succeed in business intelligence exercises, several key skills are necessary:
- Data Analysis: The ability to analyze large datasets and draw meaningful conclusions is critical. This involves identifying trends, outliers, and relationships within the data.
- Data Visualization and Reporting: The creation of clear, concise visualizations (e.g., bar charts, scatter plots, heatmaps) is vital for conveying insights effectively. Tools like Tableau and Power BI are used for this purpose.
- Data Modeling and Prediction: Data modeling involves creating structured representations of data, which can be used to make predictions about future trends. Tools like Python and R are used for predictive modeling, including regression analysis and machine learning techniques.
Practical Business Intelligence Exercises for All Levels
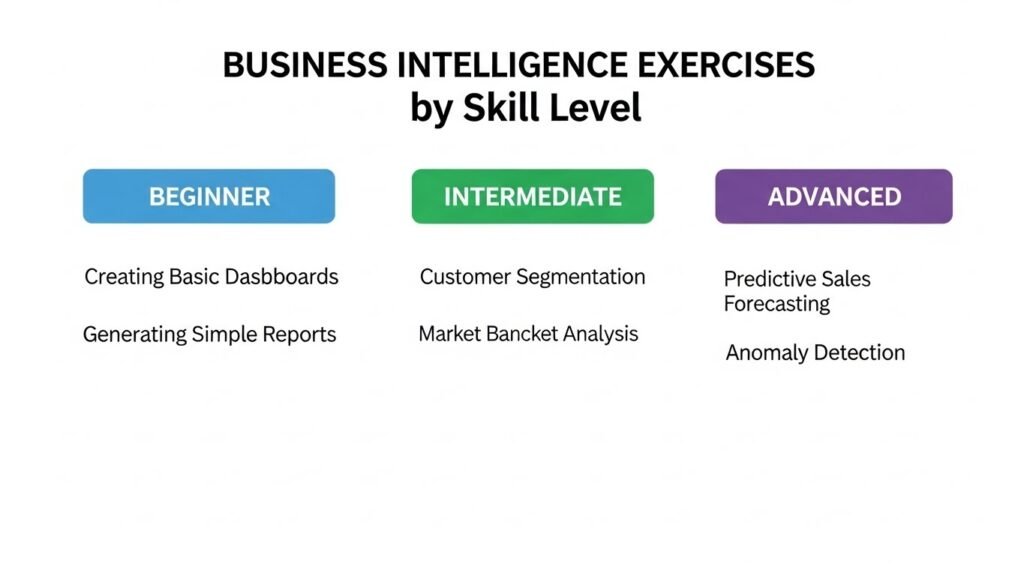
BI exercises can be classified into three main levels based on their complexity: beginner, intermediate, and advanced. Each level focuses on different aspects of BI, from basic data analysis and visualization to complex predictive modeling and scenario planning.
Beginner-Level Exercises
At the beginner level, exercises are designed to help users become comfortable with BI tools and develop basic skills in data analysis and visualization.
Exercise 1: Creating a Basic Sales Dashboard
The goal of this exercise is to create a simple dashboard to track sales data using tools like Power BI or Excel. The dashboard should include basic charts such as bar charts for sales performance and pie charts for market share.
- Skills developed: Data import, bar charts, filtering.
Exercise 2: Customer Segmentation Analysis
In this exercise, users practice grouping customers based on different variables such as demographics, behavior, or purchase history using Tableau. This can help businesses target different customer groups more effectively.
- Skills developed: Data grouping, calculated fields, segmentation.
Exercise 3: Data Cleaning with Excel
This exercise focuses on preparing data for analysis by cleaning and transforming raw data. Participants will learn to handle missing values, remove duplicates, and standardize data formats.
- Skills developed: Data cleaning, data transformation, pivot tables.
Exercise 4: SQL Queries for Sales Trends
Participants will write basic SQL queries to analyze sales data, using statements like SELECT, JOIN, and GROUP BY. This exercise helps build a foundation in querying databases and analyzing sales performance.
- Skills developed: SQL, data aggregation, JOINs.
Intermediate-Level Exercises
Intermediate-level business intelligence exercises focus on applying BI tools to more complex scenarios, like analyzing performance over time and segmenting customers based on more advanced metrics.
Exercise 5: KPI Dashboard with Power BI or Tableau
Create an interactive KPI dashboard to monitor key business metrics such as sales revenue, customer churn rate, and inventory levels. The exercise focuses on creating dynamic and visually appealing dashboards for decision-makers.
- Skills developed: Data visualization, KPI monitoring, dashboard building.
Exercise 6: Marketing Campaign ROI Tracker
This exercise helps track the performance of marketing campaigns by evaluating the return on investment (ROI). It involves analyzing campaign metrics like website traffic, conversions, and customer acquisition.
- Skills developed: ROI analysis, data blending, interactive visuals.
Exercise 7: Financial Analysis and Forecasting
Using tools like Excel or Power BI, this exercise involves analyzing historical financial data and predicting future trends. Techniques such as time-series analysis and trend lines are used to create financial forecasts.
- Skills developed: Forecasting, financial analysis, time-series analysis.
Exercise 8: Sales Funnel Analysis
This exercise focuses on creating a sales funnel that tracks customer movement from leads generated to deals won. It helps identify bottlenecks in the sales process.
- Skills developed: Funnel analysis, customer acquisition, conversion rates.
Exercise 9: Employee Performance Dashboard
Create a performance tracking dashboard for employees, visualizing metrics such as tasks completed, time spent per project, and cost per deliverable. This helps HR teams monitor and improve employee productivity.
- Skills developed: Employee productivity tracking, dashboard building.
Exercise 10: Website Traffic Analysis
Use tools like Google Analytics and Power BI to analyze website traffic patterns and trends. The goal is to understand how visitors engage with the site and identify areas for improvement.
- Skills developed: Traffic analysis, trend identification, data visualization.
Advanced-Level Exercises
At the advanced level, business intelligence exercises delve into more complex data challenges, requiring deeper knowledge of BI tools and advanced techniques such as predictive modeling, machine learning, and real-time analytics. These exercises are designed to simulate high-level business scenarios, helping participants gain expertise in advanced BI tasks.
Exercise 11: Predictive Sales Forecasting with Python
Goal: This exercise involves using Python libraries like Pandas and Scikit-Learn to predict future sales trends based on historical data. By building a predictive model, users learn to apply machine learning techniques to forecast sales, which is crucial for businesses aiming to optimize inventory, staffing, and marketing strategies.
- Skills developed: Predictive analytics, regression models, machine learning, data wrangling with Python.
Exercise 12: Blockchain Analytics for Web3 Projects
Goal: In this exercise, participants use SQL or APIs to analyze blockchain transactions and evaluate DeFi performance metrics. This is particularly useful in Web3 careers, where understanding blockchain data is essential for building applications or analyzing the health of decentralized finance protocols.
- Skills developed: Blockchain data extraction, tokenomics, API queries, decentralized finance (DeFi) analytics.
Exercise 13: Supply Chain Risk Dashboard
Goal: This exercise involves building a supply chain risk dashboard that monitors supply chain health, predicts potential disruptions, and provides insights into potential bottlenecks. The dashboard helps businesses optimize logistics and ensure timely delivery of products.
- Skills developed: Risk metrics, predictive analytics, real-time data, supply chain optimization.
Exercise 14: Multi-Source Data Integration
Goal: In this exercise, participants combine data from multiple sources such as sales, marketing, and social media to create a unified report. This is important for businesses that need to aggregate data from various departments or platforms to get a holistic view of performance.
- Skills developed: Data aggregation, multi-source integration, reporting, cross-functional collaboration.
Exercise 15: Healthcare Fraud Detection
Goal: Implement machine learning models in Python to detect anomalies and potential fraud in healthcare data. This exercise involves building models that can identify outliers or irregular patterns in healthcare transactions, which can help prevent fraud and reduce financial losses in healthcare systems.
- Skills developed: Anomaly detection, machine learning, clustering, fraud detection.
Exercise 16: Real-Time Financial Dashboard
Goal: This exercise focuses on creating real-time financial dashboards that pull live data from multiple sources (e.g., stock prices, market trends, currency rates). This dashboard allows executives to monitor financial health and make informed decisions in real-time.
- Skills developed: Real-time data integration, financial monitoring, dynamic visuals, executive reporting.
Data Storytelling and Visualization Techniques

Effective data storytelling and visualization techniques are critical skills for any business intelligence professional. These techniques help turn complex data into a narrative that is easier to understand and can drive actionable decisions. BI exercises that involve storytelling and visualization train individuals to craft clear, compelling narratives from data.
Importance of Storytelling in BI
Data storytelling is a powerful way to present insights derived from business intelligence exercises. Instead of just presenting raw data, data storytelling involves combining visuals and narratives to tell a compelling story that engages stakeholders and decision-makers.
- How to Craft a Narrative: A good data story begins with a problem statement or question, followed by analysis, insights, and a conclusion that guides decisions.
- Why It Matters: Decision-makers are more likely to act on data that is presented in a way that resonates with them emotionally and logically. A clear, well-told data story helps influence actions and decisions.
Best Practices for Visualization
The right visualization techniques help stakeholders quickly grasp complex insights. Using appropriate charts and graphs is essential for presenting data in a clear, understandable way.
- Chart Types for Different Data:
- Bar Charts: Useful for comparing categories, such as sales across regions.
- Line Charts: Best for showing trends over time, like stock prices or sales growth.
- Heatmaps: Great for showing patterns and correlations, such as customer behavior or website traffic.
- Pie Charts: Effective for showing proportions, like market share or product distribution.
- Bar Charts: Useful for comparing categories, such as sales across regions.
- Design Principles: Make sure to keep visualizations simple, avoid clutter, and use color effectively to highlight key points.
Creating Interactive Dashboards
Interactive dashboards allow users to filter data, drill down into specific details, and explore different views of the data. Tools like Power BI and Tableau are popular for building these interactive dashboards.
- Benefits of Interactivity: Interactive dashboards help users explore data on their own, leading to better understanding and faster decision-making.
- How to Build: Start by defining the key metrics, then create filters and drill-down options to allow users to navigate through the data.
Creating and Evaluating KPIs
Key Performance Indicators (KPIs) are essential for measuring business performance. Building and evaluating KPI dashboards is a crucial part of business intelligence exercises that helps organizations track progress toward strategic objectives.
Defining KPIs
What Are KPIs?
KPIs are quantifiable metrics used to evaluate the success of a business in achieving its goals. These indicators can be financial (e.g., revenue growth) or non-financial (e.g., customer satisfaction).
- Choosing the Right KPIs:
- Align KPIs with strategic objectives.
- Ensure KPIs are measurable, relevant, and achievable.
- Examples of common KPIs: Sales revenue, website traffic, customer satisfaction, employee performance.
- Align KPIs with strategic objectives.
Building a KPI Dashboard
A KPI dashboard helps track essential metrics in one place, giving decision-makers a quick overview of business performance.
- Steps to Building a KPI Dashboard:
- Identify the key metrics to track.
- Choose a BI tool (e.g., Power BI, Tableau).
- Design the dashboard layout.
- Integrate data sources and display KPIs in an intuitive format.
- Identify the key metrics to track.
- Evaluating KPI Effectiveness:
- Monitor whether KPIs align with business goals.
- Assess if KPIs are actionable and provide insights that lead to decisions.
- Monitor whether KPIs align with business goals.
Advanced BI Techniques for Data Integration and Prediction
Business intelligence (BI) exercises that focus on data integration and predictive analytics are essential for businesses looking to stay ahead of the competition. These techniques help combine disparate data sources to create a unified view of the business, while predictive analytics allows organizations to forecast future trends and outcomes.
Predictive Analytics with BI
Using Predictive Models
Predictive analytics involves using historical data to forecast future events or trends. In BI exercises, predictive models are created using machine learning algorithms such as regression analysis, clustering, and classification to make predictions about various aspects of the business.
- Types of Predictive Models:
- Regression Models: These models are used to predict continuous outcomes, like sales revenue, based on historical data.
- Classification Models: Used to predict categorical outcomes, like customer churn, based on specific data features.
- Clustering: This technique groups data into clusters that share similar characteristics, helping businesses understand customer segments or product categories.
- Regression Models: These models are used to predict continuous outcomes, like sales revenue, based on historical data.
Combining Historical Data and Predictive Models
While historical data provides insights into past performance, predictive models take that data and forecast future trends. By combining both, businesses can better prepare for potential opportunities or challenges.
- Example: A retail business could use historical sales data along with predictive modeling to forecast demand for certain products during a specific time of year, enabling better inventory management.
Scenario Planning with “What-If” Models
Creating “What-If” Scenarios
Scenario planning is an essential tool for businesses that want to test how changes in certain variables can affect outcomes. In BI exercises, this involves using BI tools to simulate various scenarios and evaluate the potential impact on key metrics.
- What-If Analysis in BI Tools:
- Power BI and Tableau allow users to create interactive reports where they can adjust variables like sales volume, pricing, or marketing spend to see how these changes affect performance.
- Excel is another useful tool for simple what-if analysis using features like data tables, goal seek, and scenario manager.
- Power BI and Tableau allow users to create interactive reports where they can adjust variables like sales volume, pricing, or marketing spend to see how these changes affect performance.
Evaluating Risks and Opportunities
Once “what-if” scenarios are created, businesses need to evaluate the risks and opportunities these scenarios present. This analysis helps businesses make informed decisions on how to proceed with strategic planning, budgeting, and resource allocation.
- Example: A company might create a scenario where they increase advertising spend by 20%. The goal is to see how this change will impact customer acquisition, sales revenue, and profit margins.
Real-World Applications and Case Studies of BI
BI is not just an abstract concept; it’s a practical tool used across various industries to solve real-world business problems. Business intelligence exercises are often based on real-world scenarios, making it essential to understand how BI is applied across different sectors. Let’s take a look at some of the most common real-world BI applications.
BI in Retail and E-commerce
Analyzing Customer Behavior
Retailers and e-commerce platforms use BI to analyze customer behavior and improve their marketing strategies. By examining metrics such as website traffic, conversion rates, and purchase history, businesses can segment customers and offer personalized promotions.
- Example: Amazon uses BI tools to track browsing history, purchase behavior, and feedback to recommend products that customers are likely to purchase, increasing sales and customer loyalty.
Sales Trends and Inventory Performance
Retailers also use BI to track sales trends and manage inventory levels. By predicting demand based on historical sales data, they can adjust inventory levels to ensure popular products are always available.
- Example: Walmart uses BI to manage its global supply chain, making data-driven decisions about which products to stock in various locations, minimizing waste and lost sales.
Healthcare Analytics
In the healthcare industry, BI tools are essential for improving patient outcomes and optimizing resource use. Healthcare providers use BI to analyze patient data, monitor treatment effectiveness, and ensure operational efficiency.
Tracking Patient Outcomes
Healthcare organizations use BI to track the outcomes of different treatments. By analyzing patient data, they can identify the most effective therapies and improve care standards.
- Example: Hospitals use BI to identify which treatments are leading to the best patient outcomes, helping them optimize care strategies and improve overall healthcare quality.
Resource Optimization
BI is also used in resource optimization, ensuring that healthcare organizations efficiently manage staff, equipment, and facilities. This helps reduce costs and increase the quality of care provided to patients.
- Example: A hospital may use real-time dashboards to monitor the occupancy rates of beds and operating rooms, ensuring that resources are allocated where they are needed most.
BI in Web3 and Blockchain Analytics
The Web3 ecosystem, which includes decentralized finance (DeFi), NFTs, and blockchain-based applications, offers unique opportunities for BI applications. BI exercises in this space focus on blockchain data analysis and understanding the economic models behind these emerging technologies.
Analyzing Blockchain Transactions
BI tools can be used to track blockchain transactions, helping businesses understand patterns of buying and selling, as well as identifying fraudulent activities. Blockchain analytics also plays a crucial role in tokenomics, the study of the economics of cryptocurrency.
- Example: Companies in the NFT market use BI tools to analyze sales data, track the performance of different NFT collections, and predict future trends based on historical data.
DeFi Performance Analytics
In decentralized finance, BI tools help monitor the performance of DeFi protocols, tracking metrics such as total value locked (TVL), liquidity, and interest rates. These insights help DeFi projects optimize their offerings and attract more users.
- Example: A DeFi platform might use BI tools to track the performance of its liquidity pools and adjust interest rates to ensure competitiveness.
Employee and Operations Management
BI tools are also used to optimize internal operations, especially when it comes to managing employee performance and improving operational efficiency.
Employee Productivity Visualization
Organizations use BI to track employee performance, measuring metrics such as tasks completed, time spent on projects, and cost per deliverable. These metrics help HR teams identify top performers and areas where employees may need additional support.
- Example: A company uses BI dashboards to visualize employee productivity, helping them allocate resources more efficiently and make informed decisions about promotions and training.
Operations Optimization
BI exercises in operations management involve analyzing key business processes to identify inefficiencies, bottlenecks, and opportunities for improvement.
- Example: Manufacturers use BI to monitor production lines and reduce downtime by predicting when machines need maintenance, ensuring smooth and continuous production.
Supply Chain Management
Supply chain management is one of the most critical areas for BI application. Using BI tools, businesses can track inventory levels, forecast demand, and optimize logistics to ensure timely delivery and reduce costs.
- Example: A logistics company uses BI to track the movement of goods across the supply chain and predict potential delays, helping them make real-time adjustments to routes or inventory management.
Overcoming Challenges in BI Exercises
While business intelligence exercises offer a wealth of opportunities to develop valuable skills, there are also several challenges that businesses and individuals must overcome. These challenges range from dealing with poor data quality to mastering complex BI tools. Understanding these challenges and finding ways to address them is critical for success in BI.
Data Quality and Integration Challenges
Dealing with Data Quality Issues
One of the most common challenges in business intelligence exercises is dealing with data quality issues. Raw data often contains errors, inconsistencies, or missing values that can significantly impact the quality of insights derived from it. Data cleansing is a crucial step in the BI process, and it involves identifying and correcting these issues before the data can be analyzed.
- Types of Data Quality Issues:
- Missing Data: Gaps in data where information is unavailable, leading to incomplete analyses.
- Duplicate Data: Repeated entries that can distort results.
- Inconsistent Data: Variations in data formats, units, or naming conventions that make it difficult to aggregate or compare data.
- Missing Data: Gaps in data where information is unavailable, leading to incomplete analyses.
Solutions for Data Quality Issues:
- Data Cleaning Tools: Tools like Power BI’s Query Editor, Python (Pandas), and Excel offer built-in functions for identifying and fixing data quality issues.
- Standardization: Ensuring that data is entered in a consistent format across all systems can help prevent errors.
- Imputation: When data is missing, techniques like data imputation can be used to fill in the gaps with estimated values.
Integrating Data from Multiple Sources
Another challenge is data integration, which involves merging data from various sources such as CRM systems, sales platforms, and external databases. Integrating these sources can be difficult, especially when data comes in different formats or has different structures.
- Solutions for Data Integration:
- ETL Processes (Extract, Transform, Load): BI tools like Power BI and Tableau use ETL processes to extract data from multiple sources, transform it into a usable format, and load it into a data warehouse.
- Data Warehousing: Storing integrated data in a central repository allows for easier analysis and reporting.
- ETL Processes (Extract, Transform, Load): BI tools like Power BI and Tableau use ETL processes to extract data from multiple sources, transform it into a usable format, and load it into a data warehouse.
Tool Complexity and Learning Curves
Mastering Advanced BI Tools
Many business intelligence tools come with steep learning curves, especially for beginners. Tools like Tableau, Power BI, and SQL require time and effort to learn, and their advanced features can seem overwhelming at first.
Solutions to Overcome Tool Complexity:
- Training Resources: Online tutorials, forums, and certification programs are widely available for mastering BI tools. Websites like DataCamp, Coursera, and LinkedIn Learning offer structured learning paths.
- Hands-On Practice: The best way to learn BI tools is through practice. Engaging in business intelligence exercises and working with real datasets is the most effective way to gain proficiency.
- Community Support: Many BI platforms have active user communities where beginners can ask questions and share experiences.
Time Management and Resource Allocation
Allocating Time for BI Exercises
In busy business environments, finding time to complete business intelligence exercises can be challenging. It is essential to prioritize exercises based on their relevance to business objectives and career goals.
Solutions for Time Management:
- Set Clear Goals: Define the specific skills or knowledge you want to gain from each exercise. This will help you focus on tasks that are directly aligned with your goals.
- Block Dedicated Time: Set aside specific times each week to work on BI exercises. Even dedicating 30 minutes a day can yield significant progress over time.
- Start Small: Begin with smaller exercises and gradually increase the complexity as you become more comfortable with the tools and techniques.
Resource Management:
- Access to Tools: Ensure you have access to the necessary BI tools and resources, whether through free trials, educational versions, or company-provided licenses.
- Data Availability: If you’re working on a personal BI project, make sure you have access to clean, high-quality datasets. Open-source datasets are available on platforms like Kaggle and Data.gov.
Building a BI Portfolio for Career Advancement
Having a strong business intelligence portfolio is essential for demonstrating your skills to potential employers or clients. A well-structured portfolio highlights your BI capabilities and shows your ability to solve real-world business problems.
Documenting and Showcasing Your Work
Creating a BI Portfolio
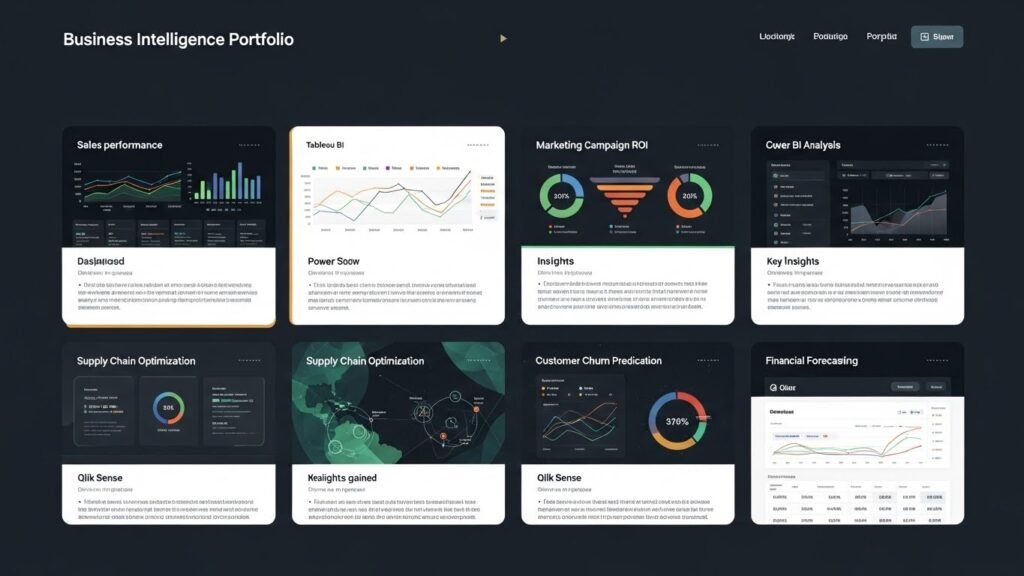
A BI portfolio showcases the business intelligence exercises you’ve completed, the tools you’ve used, and the insights you’ve generated. It serves as a concrete demonstration of your skills and can be shared with potential employers, clients, or stakeholders.
- Elements of a BI Portfolio:
- Project Descriptions: For each project or exercise, provide a brief description of the challenge, your approach, the tools you used, and the results.
- Visualizations and Dashboards: Include screenshots of the dashboards or visualizations you created, showcasing your ability to present data effectively.
- Code and Scripts: If you used coding languages like Python or SQL, include snippets of code to demonstrate your technical expertise.
- Results and Insights: Highlight key findings from your analysis, demonstrating the value your work can bring to decision-making.
- Project Descriptions: For each project or exercise, provide a brief description of the challenge, your approach, the tools you used, and the results.
Building a Personal Brand through BI Projects
Leveraging Your BI Work to Build Your Brand
Your BI portfolio can also be used to build a personal brand. By sharing your projects on platforms like LinkedIn, GitHub, or Medium, you can establish yourself as an expert in the field of business intelligence.
- Sharing on LinkedIn: Regularly post updates on your BI projects, share insights from your exercises, and engage with the BI community.
- Contributing to GitHub: Share your code, scripts, and dashboards on GitHub to showcase your technical skills.
- Blogging and Writing Articles: Writing articles about BI topics or sharing case studies of your BI projects can help position you as a thought leader.
Leveraging BI for Job Market Success
In today’s competitive job market, having business intelligence skills can significantly improve your employability. Organizations are increasingly relying on data to make decisions, and BI professionals are in high demand.
Using BI to Stand Out in Job Markets
A strong BI portfolio not only helps you demonstrate your technical abilities but also showcases your problem-solving and decision-making skills. By highlighting your BI experience and accomplishments, you can make yourself more attractive to potential employers.
- Targeting BI Roles: Highlight your BI expertise in your resume, portfolio, and LinkedIn profile. Focus on roles like BI Analyst, Data Analyst, Data Scientist, and Web3 Analytics.
- Networking and Collaboration: Attend BI-related events, webinars, and conferences to expand your professional network. Collaborating with other BI professionals can open doors to new job opportunities.
Conclusion
In conclusion, business intelligence exercises are invaluable tools for developing the essential skills required to succeed in today’s data-driven business world. These exercises enable individuals to gain hands-on experience with BI tools, improve their data analysis and visualization capabilities, and enhance their ability to make informed decisions based on data. Whether you are a beginner or an advanced BI professional, engaging in these exercises is a practical and effective way to improve your proficiency and become more competitive in the job market.
Recap of Key BI Exercises
Throughout this article, we have covered a variety of business intelligence exercises that range from basic data analysis to complex predictive modeling and scenario planning. The key exercises include:
- Sales Dashboard Creation: Building dashboards to track and visualize key business metrics such as sales revenue and customer behavior.
- Customer Segmentation: Grouping customers based on various criteria to personalize marketing efforts and improve customer engagement.
- Data Cleaning and Transformation: Preparing raw data for analysis by removing inconsistencies and errors, ensuring that the data is clean and usable.
- Predictive Analytics: Using machine learning and statistical models to forecast future trends, sales, and customer behavior.
- What-If Scenario Analysis: Simulating different business scenarios to understand potential outcomes and guide strategic decisions.
These exercises provide a hands-on approach to learning the tools and techniques needed for data-driven decision-making, making them essential for anyone looking to build a career in business intelligence or data science.
Looking Ahead
The future of business intelligence is exciting, with BI tools continuing to evolve and play an even larger role in business decision-making. As more companies recognize the value of data-driven insights, the demand for skilled BI professionals is expected to grow. The ability to work with advanced BI tools and understand complex data sets will be increasingly important in a wide range of industries, including retail, healthcare, finance, and Web3.
As technology continues to advance, new BI techniques such as real-time analytics, AI-driven insights, and predictive modeling will become more prevalent. Professionals who stay up-to-date with the latest trends in BI and continue to practice their skills through business intelligence exercises will be well-positioned for success.
Final Thoughts
Business intelligence exercises are not just theoretical; they are an essential part of real-world business strategies. Engaging in BI exercises allows individuals to bridge the gap between theory and practice, enabling them to apply what they’ve learned to solve complex business problems. These exercises help you develop a solid foundation in BI, which will serve as a stepping stone to more advanced roles in data science, BI consulting, or Web3 analytics.
Whether you’re working on sales forecasting, inventory management, or predicting customer behavior, the insights derived from BI exercises can empower businesses to make smarter, data-driven decisions. BI has become a critical tool in modern business, and the ability to navigate the BI landscape will only become more valuable as we move toward an increasingly data-centric future.
Final Takeaways on Business Intelligence Exercises
Business Intelligence Exercises are the cornerstone of any data-driven business strategy. From basic data analysis to advanced predictive modeling, these exercises are designed to equip individuals with the practical skills necessary to succeed in today’s rapidly evolving business world. Whether you’re looking to advance your career or contribute to your organization’s success, mastering business intelligence tools and techniques will provide you with a competitive advantage.
The Role of Business Intelligence in Modern Organizations
The role of BI tools has expanded beyond just reporting and dashboards. Today, businesses rely on data-driven insights to guide decision-making at every level of the organization, from operational efficiency to long-term strategic planning. As companies increasingly look to optimize their operations, business intelligence becomes an integral part of their overall strategy.
By working on business intelligence exercises, individuals gain a deeper understanding of how to handle real-world data problems. These exercises help reinforce skills like data cleaning, aggregation, and forecasting, all of which are critical for making accurate business predictions. Moreover, the ability to effectively visualize data and communicate insights plays a key role in ensuring that decision-makers can easily interpret complex data sets.
Continuous Learning and Improvement
While BI tools and techniques are evolving rapidly, one thing remains constant: the need for continuous learning and hands-on practice. In the BI field, new tools, methodologies, and technologies are introduced regularly, and staying up-to-date with these innovations is crucial for career advancement.
- Practice: The more BI exercises you complete, the more comfortable you become with the tools and techniques. As you progress, the complexity of the exercises can be increased to challenge your skills further.
- Collaboration: Many BI projects require cross-functional collaboration. Working with different departments or teams helps develop a holistic understanding of business processes and data analysis.
By continuously improving and expanding your BI expertise through regular practice, you’ll ensure that you stay ahead of the curve and are ready to tackle the most complex business challenges.
The Future of Business Intelligence Exercises
Looking to the future, business intelligence will continue to evolve, and so will the exercises that accompany it. Predictive analytics and AI-driven insights are likely to dominate the future of BI, with machine learning models and automated reporting becoming more integrated into everyday business processes. As these tools become more advanced, business intelligence exercises will also become more sophisticated, incorporating real-time data analysis and cloud-based BI solutions.
Organizations are increasingly focusing on data-driven decision-making, and as a result, there will be a growing demand for professionals who are proficient in BI tools and data analysis techniques. This makes it essential for individuals who want to remain competitive in the field to continuously improve their BI skills and engage with hands-on business intelligence exercises.
Conclusion: Why Business Intelligence Exercises Matter
In conclusion, business intelligence exercises are more than just an academic exercise—they are a vital part of developing the skills necessary for success in a data-driven world. These exercises provide practical experience with BI tools, help build strong analytical capabilities, and enhance your ability to make strategic decisions based on data insights.
For organizations, adopting business intelligence practices can lead to improved decision-making, optimized operations, and a stronger competitive position in the marketplace. For individuals, mastering BI exercises will not only improve your technical skills but also help you develop a personal brand that stands out in the job market. Whether you’re just starting out in data analysis or looking to level up your BI expertise, engaging in business intelligence exercises will ensure you stay ahead of the curve.